

Key takeaways:
Most clients pay $0 with employer sponsored insurance.
Key takeaways
- Fasting insulin usually moves before fasting glucose. Glucose tells you the result. Insulin tells you the effort behind it.
- In BetterBrain's dashboard, optimal fasting insulin is below 6 mcIU/mL. The fair range runs from 6 to 19.6.
- Higher fasting insulin has been associated with roughly double the Alzheimer's risk in adults 65 and older, with the strongest association in people who did not have diabetes.
- Metabolic syndrome has been associated with a 24% higher risk of young-onset dementia, with a dose response as components accumulate.
- These are observational findings. They establish association, not cause.
- Most standard panels stop at glucose and HbA1c. Fasting insulin is inexpensive and is included in BetterBrain's Essentials panel.
For most people, metabolic health shows up as one line on a lab report. Fasting glucose, 94 mg/dL, flagged normal, nothing to discuss, see you next year.
That reading is accurate. But fasting glucose is also one of the last things to change. Your body can spend years quietly working to hold that number in range, and the work it does to hold it is where the brain story actually starts.
What is fasting insulin?
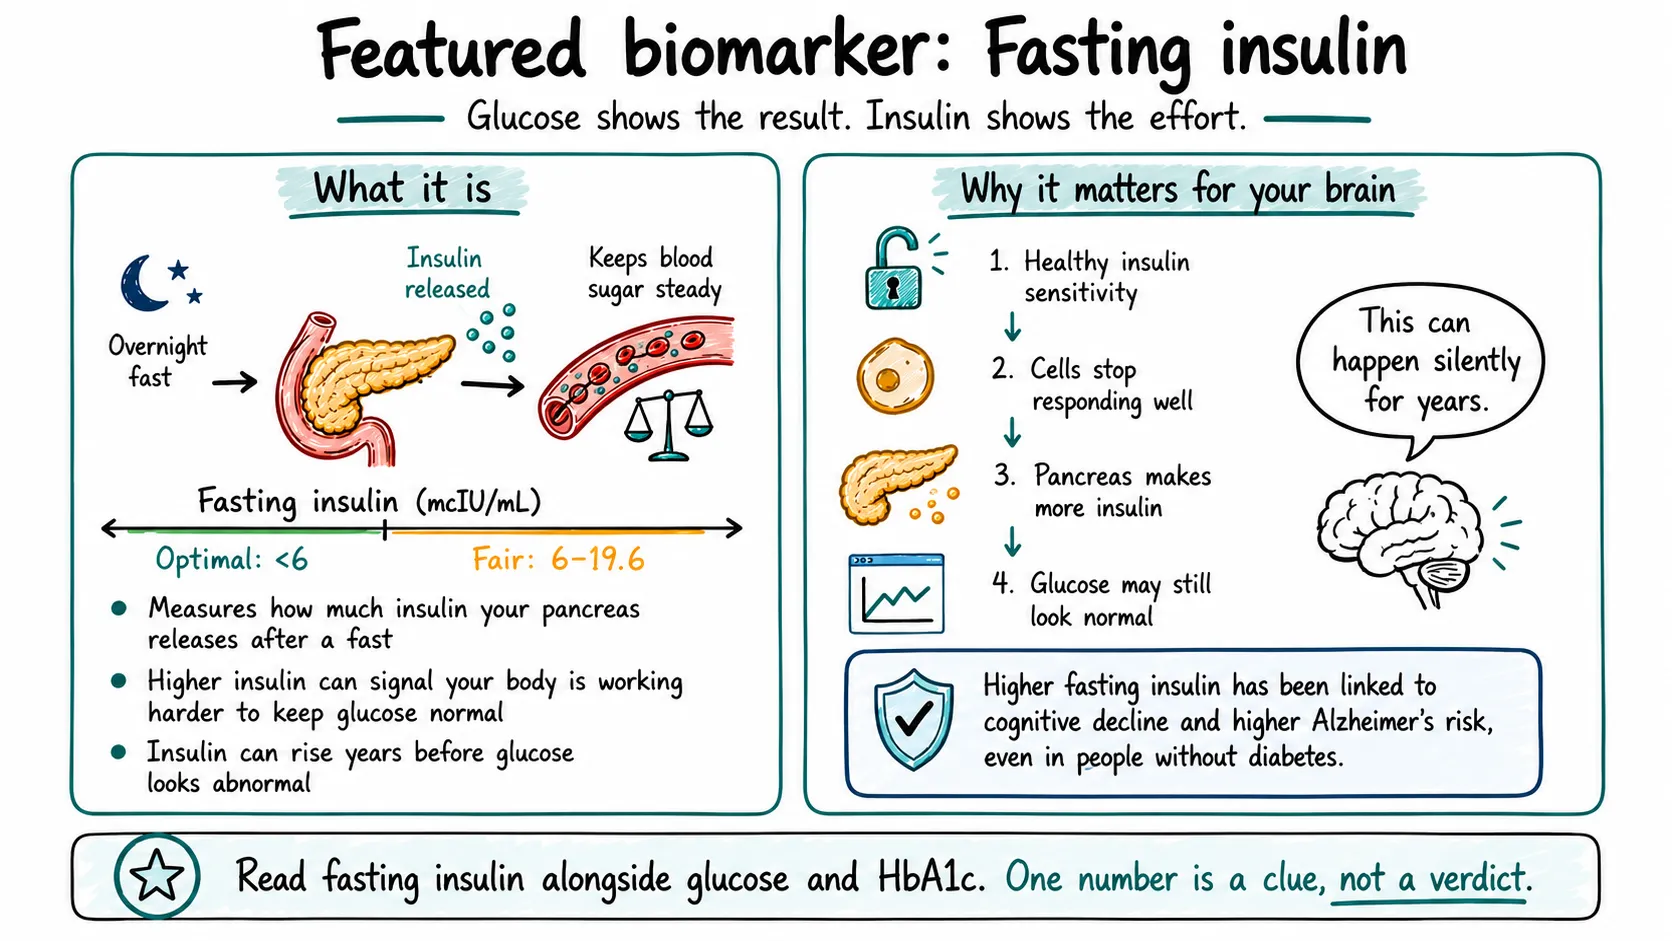
Fasting insulin measures how much insulin your pancreas is releasing to keep your blood sugar steady after an overnight fast.
Insulin is the hormone that moves glucose out of your bloodstream and into your cells. A fasting insulin test tells you how much of that hormone your body needs to hold a normal blood sugar level while you are not eating. A low number means your cells are responding easily. A higher number means your body is working harder to reach the same result.
In your BetterBrain dashboard, the optimal range for fasting insulin is below 6 mcIU/mL. Above 6, and into the fair range of 6 to 19.6, the picture starts to shift.
The distinction that matters: glucose tells you the result, insulin tells you the effort behind it.
Why your glucose can look normal for years
When cells stop responding well to insulin, the pancreas compensates by producing more of it. Glucose can stay in range through that entire process, sometimes for years, while insulin climbs in the background.
This is why a single normal glucose reading is an incomplete picture. It is a true measurement of an outcome, not a measurement of how much work went into producing that outcome.
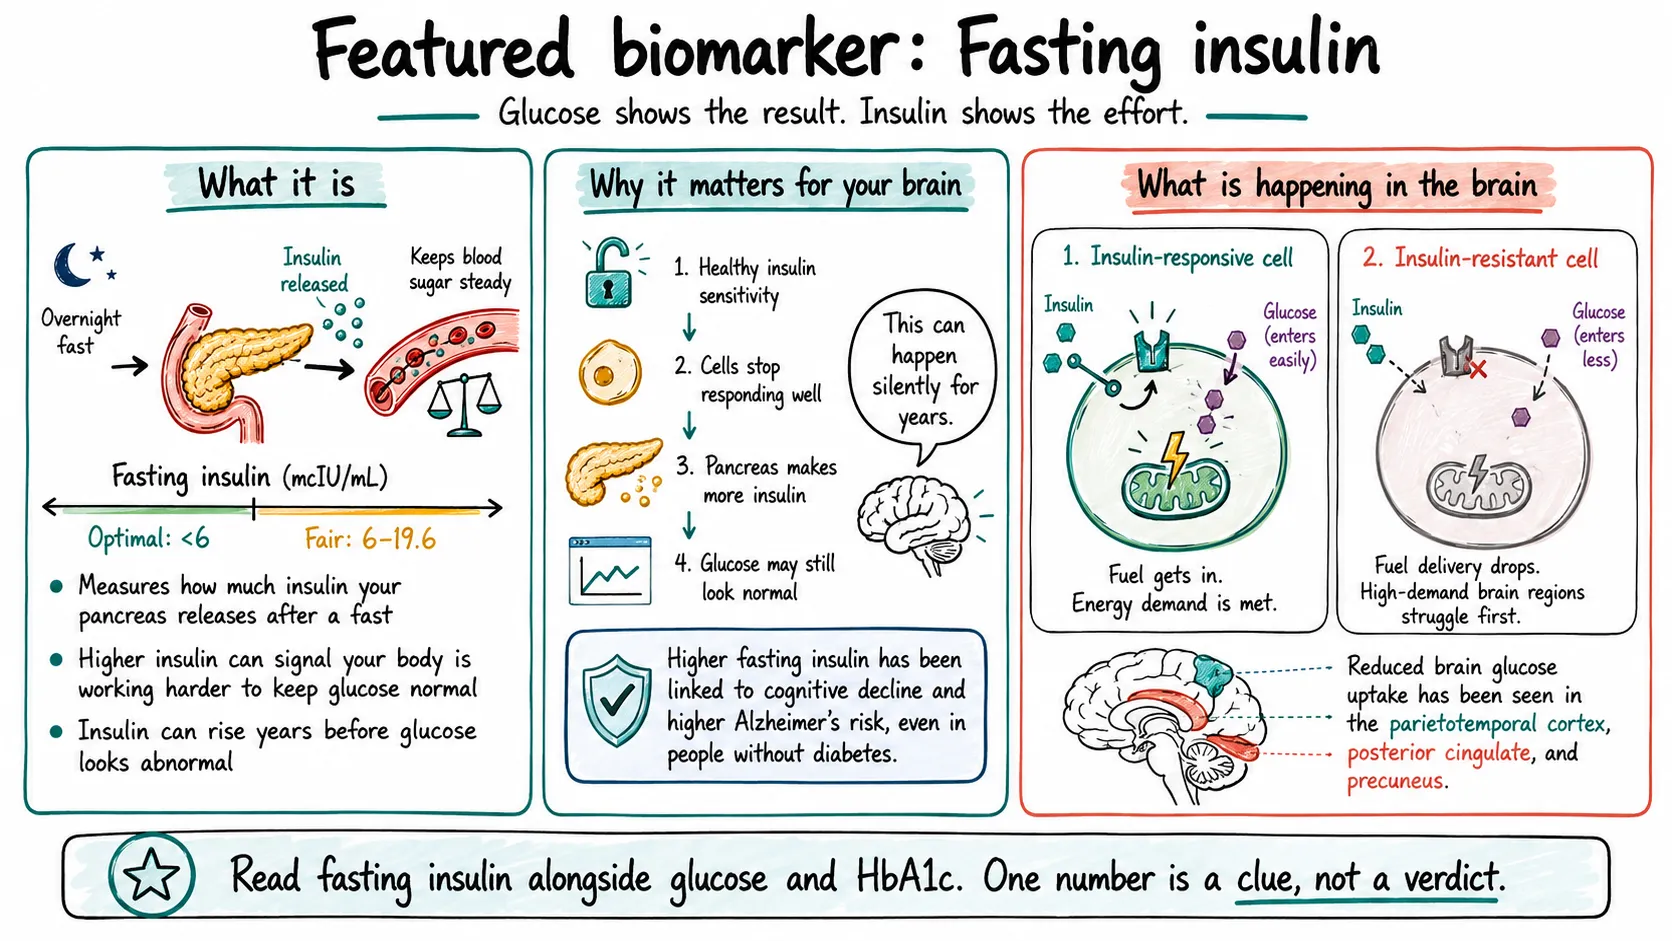
Fasting insulin can rise years before glucose looks abnormal.
What the research says about insulin and the brain
Older adults: Alzheimer's risk roughly doubled
In a study published in Neurology, researchers tracked 683 adults aged 65 and older for nearly 3,700 person-years. Alzheimer's risk roughly doubled among people with hyperinsulinemia, and the association was strongest in people who did not have diabetes.
That last detail is the important one. The association was not explained by diabetes being present.
Midlife: the same pattern, six years later
In the ARIC cohort, adults aged 45 to 64 had fasting insulin measured at baseline. Six years later, higher baseline insulin predicted greater decline in delayed word recall and verbal fluency.
The authors described insulin resistance as a potentially modifiable midlife risk factor. That phrase matters because it points at what you can do about it.
A note on complexity
Very low fasting insulin has also been associated with risk in some long follow-up studies, so the relationship is not a straight line. This is exactly why we read insulin alongside glucose, HbA1c, and the rest of the domain rather than treating any single number as a verdict.
What is actually happening in your brain
Your brain is roughly 2% of your body weight and uses about 20% of your resting energy, almost all of it from glucose. Getting that fuel where it needs to go depends on insulin signaling working.
A systematic review of 23 imaging studies covering 5,308 participants found that insulin resistance was associated with reduced glucose uptake in the brain across 22 of 23 studies. The regions involved, the parietotemporal cortex, posterior cingulate, and precuneus, are the same areas that show reduced metabolism in Alzheimer's disease. Some of those associations appeared in people who were cognitively normal at the time of scanning.
Cells that respond poorly to insulin have a harder time pulling in fuel. Consequently, the parts of your brain with the highest energy demand are the ones affected first.
Metabolic syndrome and dementia risk: when the components stack
A 2025 study in Neurology followed nearly 2 million Korean adults aged 40 to 60 for an average of 7.8 years.
Metabolic syndrome, defined as three or more of excess belly fat, high blood pressure, elevated fasting glucose, elevated triglycerides, and low HDL, was associated with a 24% higher risk of young-onset dementia. Each component added to the effect, and participants with all five had roughly 70% higher risk.
Two things worth noting: the association was stronger in people in their 40s than in their 50s, and stronger in women (34%) than in men (15%).
This is observational research, which establishes association, not cause. It is one national population, and the researchers could not account for APOE status. What it does establish clearly: the direction of the effect, a dose response across components, and earlier timing than most people assume.
The metabolic health domain: which markers we read together
When we assess metabolic health at BetterBrain, it is one of the ten health domains we track. We read a group of markers together rather than checking any one off in isolation:
GroupMarkersWhat it tells youGlucose controlFasting glucose, HbA1c, fasting insulinHow easily your body manages fuelLipid loadTriglycerides, ApoBHow much lipid your system is carryingLiver stressALT, ASTHow much metabolic work your liver is absorbingNutrient statusVitamin D, B12, folateWhether you have the raw materials to make and use energy
Any one of these can look unremarkable on its own. Read together, they tell you something a single value can't: whether your body is handling fuel comfortably, or working hard to look like it is.
What you can do
Test your fasting insulin, not just glucose. Most standard panels stop at fasting glucose and HbA1c. Fasting insulin tends to move first, it is inexpensive, and it is included in the 50+ biomarkers in the BetterBrain Essentials panel.
Move after you eat. A short walk in the hour after a meal meaningfully blunts the glucose rise. This is one of the higher-return habits in the metabolic domain because it costs almost nothing. One BetterBrain client liked the idea enough to build a free app for it, called Exercise Snacks for Health & Wellbeing.
Build meals around protein and fiber before the starch. Same food, different order, measurably flatter glucose response. Vegetables and protein first, then the carbohydrate portion.
Finish eating three to four hours before bed. Late meals land against a window when insulin sensitivity is at its lowest. Moving dinner earlier is one of the easiest and most impactful techniques to manage glucose spikes.
Retest and see it move. Fasting insulin and triglycerides respond within weeks. HbA1c takes two to three months to reflect a real change. Knowing which to watch first keeps you from concluding too early that nothing is happening.
Frequently asked questions
Can you have insulin resistance with normal blood sugar?
Yes. When cells stop responding well to insulin, the pancreas compensates by producing more of it, which can hold glucose in the normal range for years. Fasting glucose is typically one of the last metabolic markers to change, which is why a normal reading does not rule out insulin resistance.
What is a good fasting insulin level?
In BetterBrain's dashboard, the optimal range for fasting insulin is below 6 mcIU/mL, with a fair range of 6 to 19.6. Reference ranges vary between labs, and fasting insulin should be interpreted alongside fasting glucose and HbA1c rather than on its own.
Is fasting insulin included in a standard blood panel?
Usually not. Most standard panels stop at fasting glucose and HbA1c. Fasting insulin generally has to be requested specifically. It is included in BetterBrain's Essentials panel of 50+ biomarkers.
Does insulin resistance affect the brain?
Research as associated insulin resistance with reduced glucose uptake in the brain. A systematic review of 23 imaging studies covering 5,308 participants found this association in 22 of the 23 studies, in the parietotemporal cortex, posterior cingulate, and precuneus. Some of those associations appeared in people who were cognitively normal at the time of scanning. These are observational findings.
How quickl can fasting insulin improve?
Fasting inslin and triglycerides can respond within weeks. HbA1c reflects roughly two to three months of glucose exposure, so it takes longer to show a real change. Knowing which marker moves first prevents you from concluding too early that nothing is working.
What is metaolic syndrome?
Metabolic synrome is defined as having three or more of the following: excess belly fat, high blood pressure, elevated fasting glucose, elevated triglycerides, and low HDL cholesterol. A 2025 study of nearly 2 million adults associated it with a 24% higher risk of young-onset dementia, with risk increasing as more components were present.
The bottom line
Metabolic health is not a number you pass or fail. It is a set of markers that move together, and it is the domain where what you do this month shows up in your labs this quarter.
If you have not seen your full metabolic picture, that is a good place to start. Blueprint includes 50+ biomarkers, a consultation of up to 90 minutes with a brain health expert, and a personalized action plan ranked by impact. $89 with insurance, $399 cash pay.
Already have your results? View your metabolic markers to see where you sit and which techniques your Brain Health Coach recommends first.

References
References
- Luchsinger JA, et al. Hyperinsulinemia and risk of Alzheimer disease. Neurology. 2004. https://www.neurology.org/doi/abs/10.1212/01.wnl.0000140292.04932.87
- Young SE, et al. Hyperinsulinemia and cognitive decline in a middle-aged cohort (ARIC). Diabetes Care. 2006. https://diabetesjournals.org/care/article/29/12/2688/26277/Hyperinsulinemia-and-Cognitive-Decline-in-a-Middle
- Systematic review of brain glucose uptake and insulin resistance, 23 imaging studies, 5,308 participants. https://pmc.ncbi.nlm.nih.gov/articles/PMC11876560/
- Lee J, et al. Metabolic syndrome and young-onset dementia. Neurology. 2025. https://www.neurology.org/doi/10.1212/WNL.0000000000213599